What is the market research survey form template?
Before launching a product, entering a new market or changing your pricing, it helps to hear from the people you hope to sell to. A well-structured survey gives you comparable answers from many people — who they are, how they buy today, what frustrates them and what they'd pay.
This market research survey has four pages: optional demographics, current buying habits (how often, where, how much, which brand and how important factors like price, quality and sustainability are), needs and price expectations, and a final page for comments and follow-up. People who never buy in the category are asked why.
Respondents are asked for their consent to use their answers for research, and can volunteer for a follow-up interview or product test. Each response is saved as a PDF in your FileIt vault and the full set exports to CSV for analysis.
- Best for
- Startups, small businesses, marketing teams, students and researchers
- Filled in by
- Members of your target market
- Time to complete
- About 5 minutes
- Includes
- Demographics, purchase frequency and channels, decision-factor grid, top-three wishlist, interest scale, price expectations, research consent
Who uses a market research survey form?
- A startup tests demand for a new product before building it
- A local business surveys residents before opening a new location
- A marketing team profiles customers for a new campaign
- A student collects data for a marketing research project
- A brand checks price expectations before a launch
- A company recruits participants for follow-up interviews
Questions on this market research survey form
26 questions over 4 pages · includes conditional questions, multiple pages, consent checkbox, ratings.
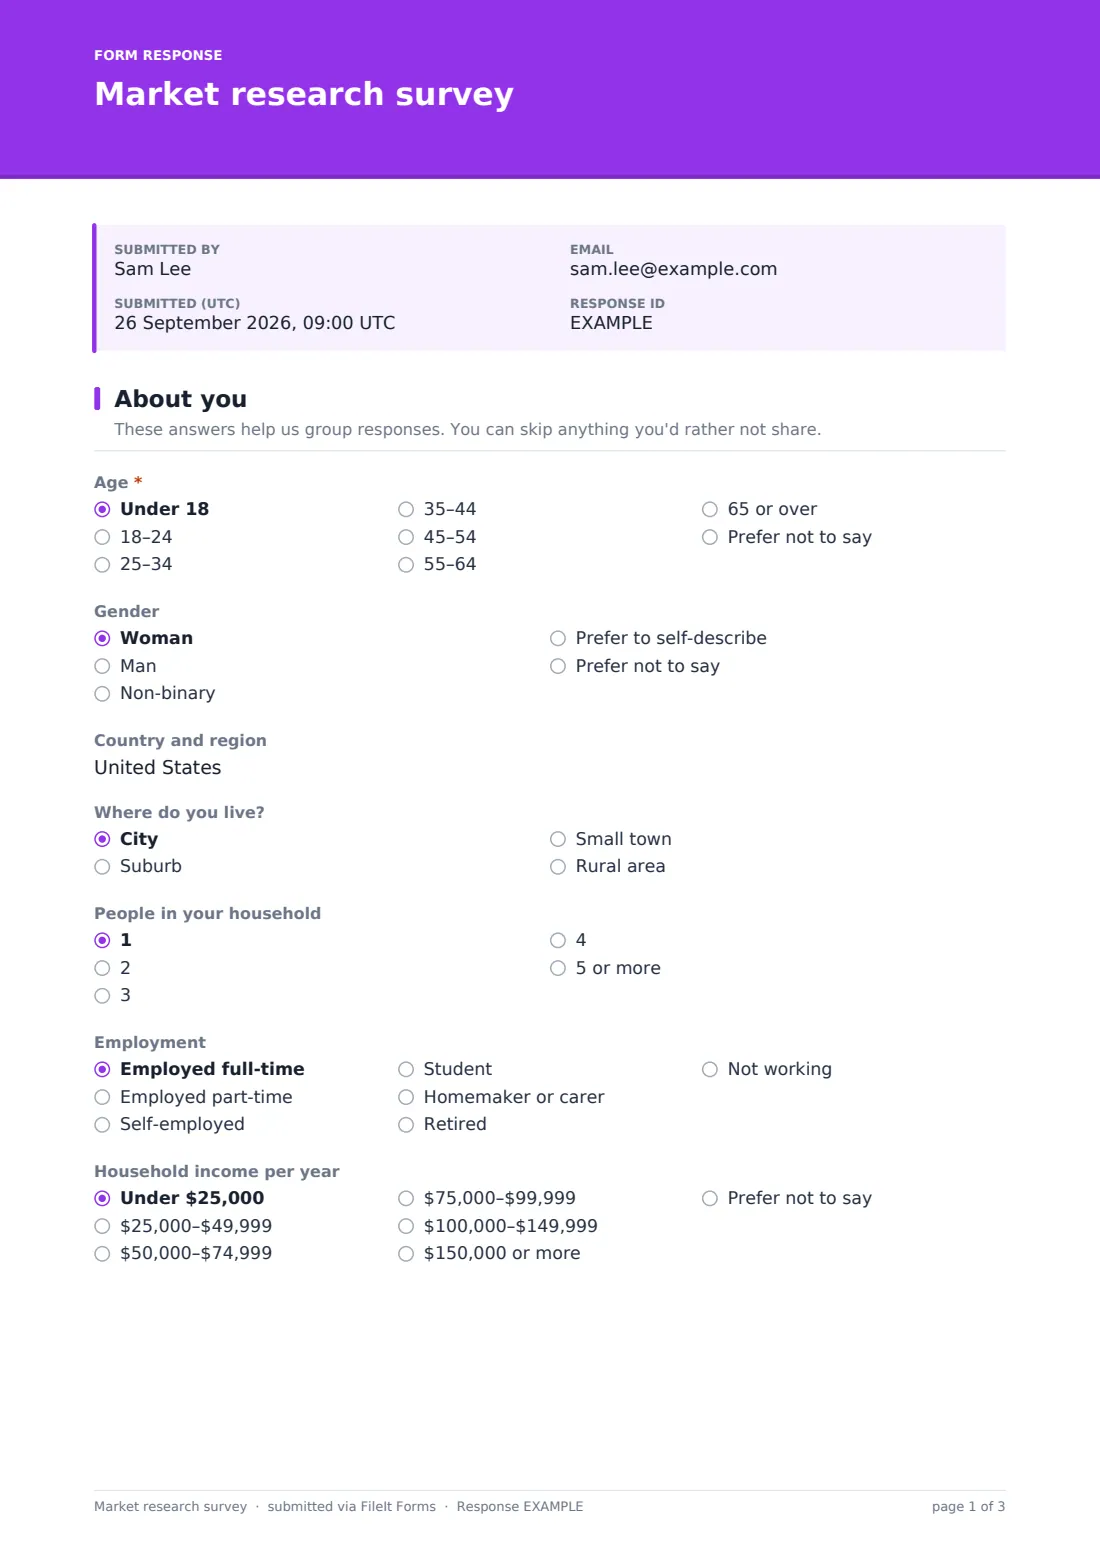
1 About you
- Age* Under 18 · 18–24 · 25–34 · 35–44 · 45–54 · 55–64 · 65 or over · Prefer not to say
- Gender Woman · Man · Non-binary · Prefer to self-describe · Prefer not to say
- How do you describe your gender? asked only when it applies
- Country and region
- Where do you live? City · Suburb · Small town · Rural area
- People in your household 1 · 2 · 3 · 4 · 5 or more
- Employment Employed full-time · Employed part-time · Self-employed · Student · Homemaker or carer · Retired · Not working
- Household income per year Under $25,000 · $25,000–$49,999 · $50,000–$74,999 · $75,000–$99,999 · $100,000–$149,999 · $150,000 or more · Prefer not to say
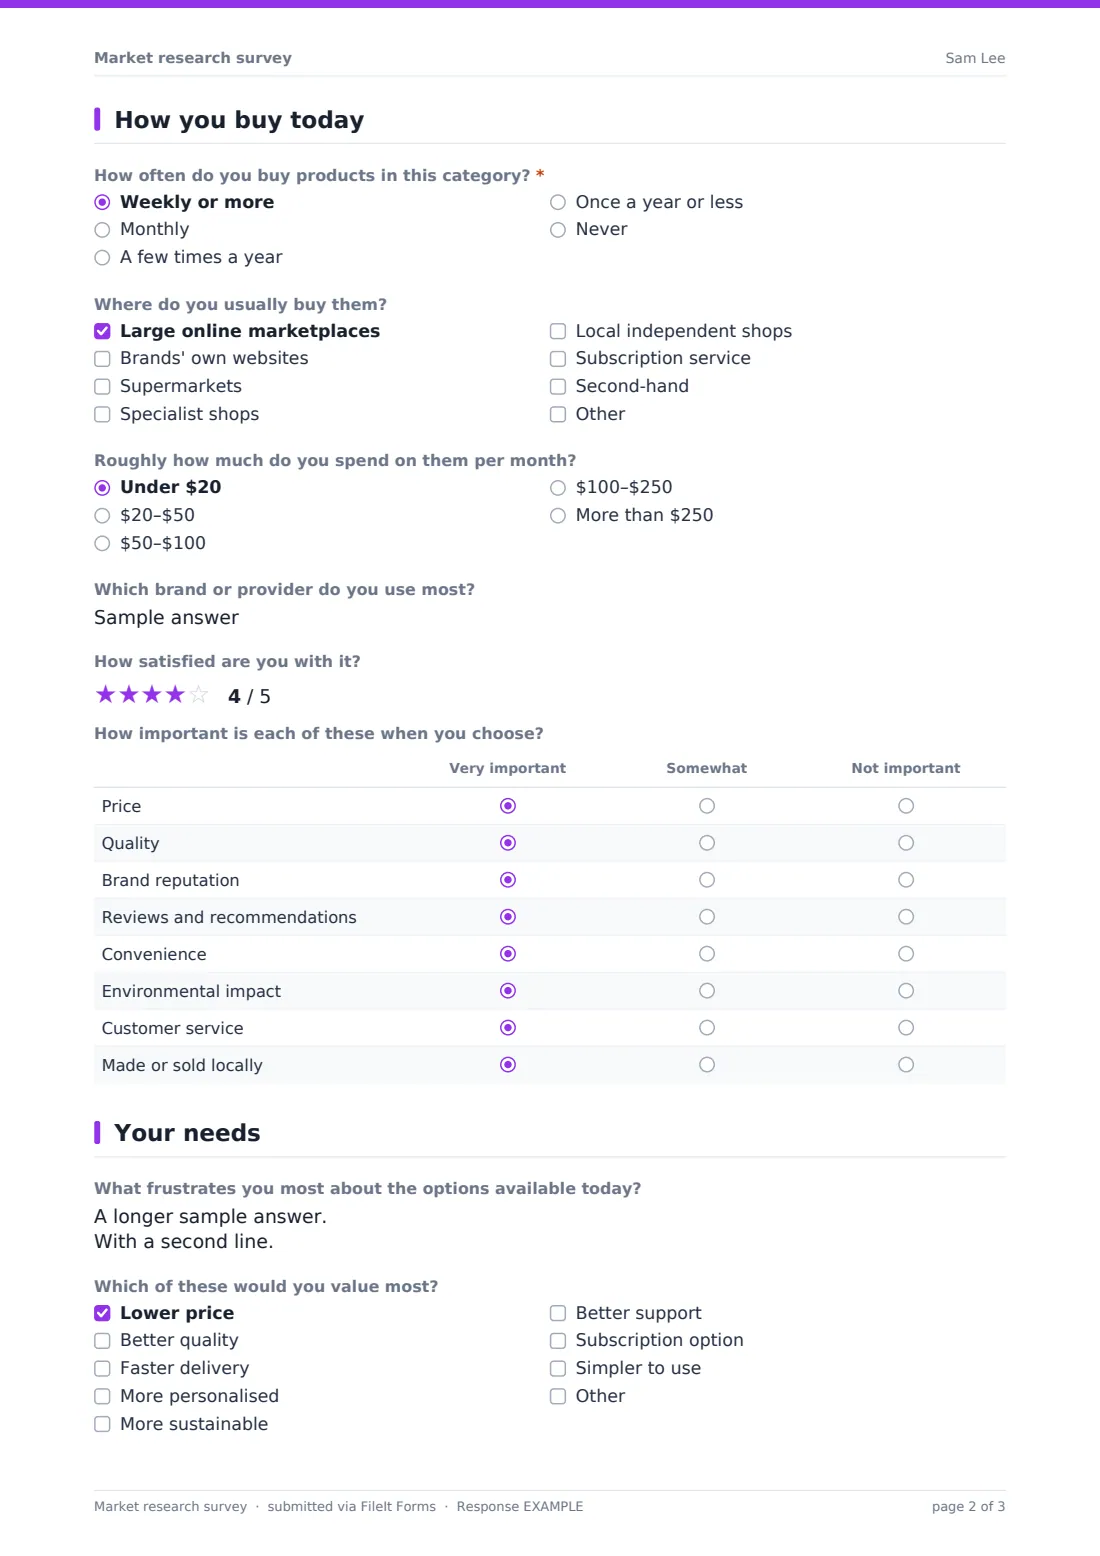
2 How you buy today
- How often do you buy products in this category?* Weekly or more · Monthly · A few times a year · Once a year or less · Never
- What's the main reason you don't buy them? asked only when it applies
- Where do you usually buy them? asked only when it applies Large online marketplaces · Brands' own websites · Supermarkets · Specialist shops · Local independent shops · Subscription service · Second-hand
- Roughly how much do you spend on them per month? asked only when it applies Under $20 · $20–$50 · $50–$100 · $100–$250 · More than $250
- Which brand or provider do you use most? asked only when it applies
- How satisfied are you with it? asked only when it applies
- How important is each of these when you choose? Very important · Somewhat · Not important
3 Your needs
- What frustrates you most about the options available today?
- Which of these would you value most? Lower price · Better quality · Faster delivery · More personalised · More sustainable · Better support · Subscription option · Simpler to use
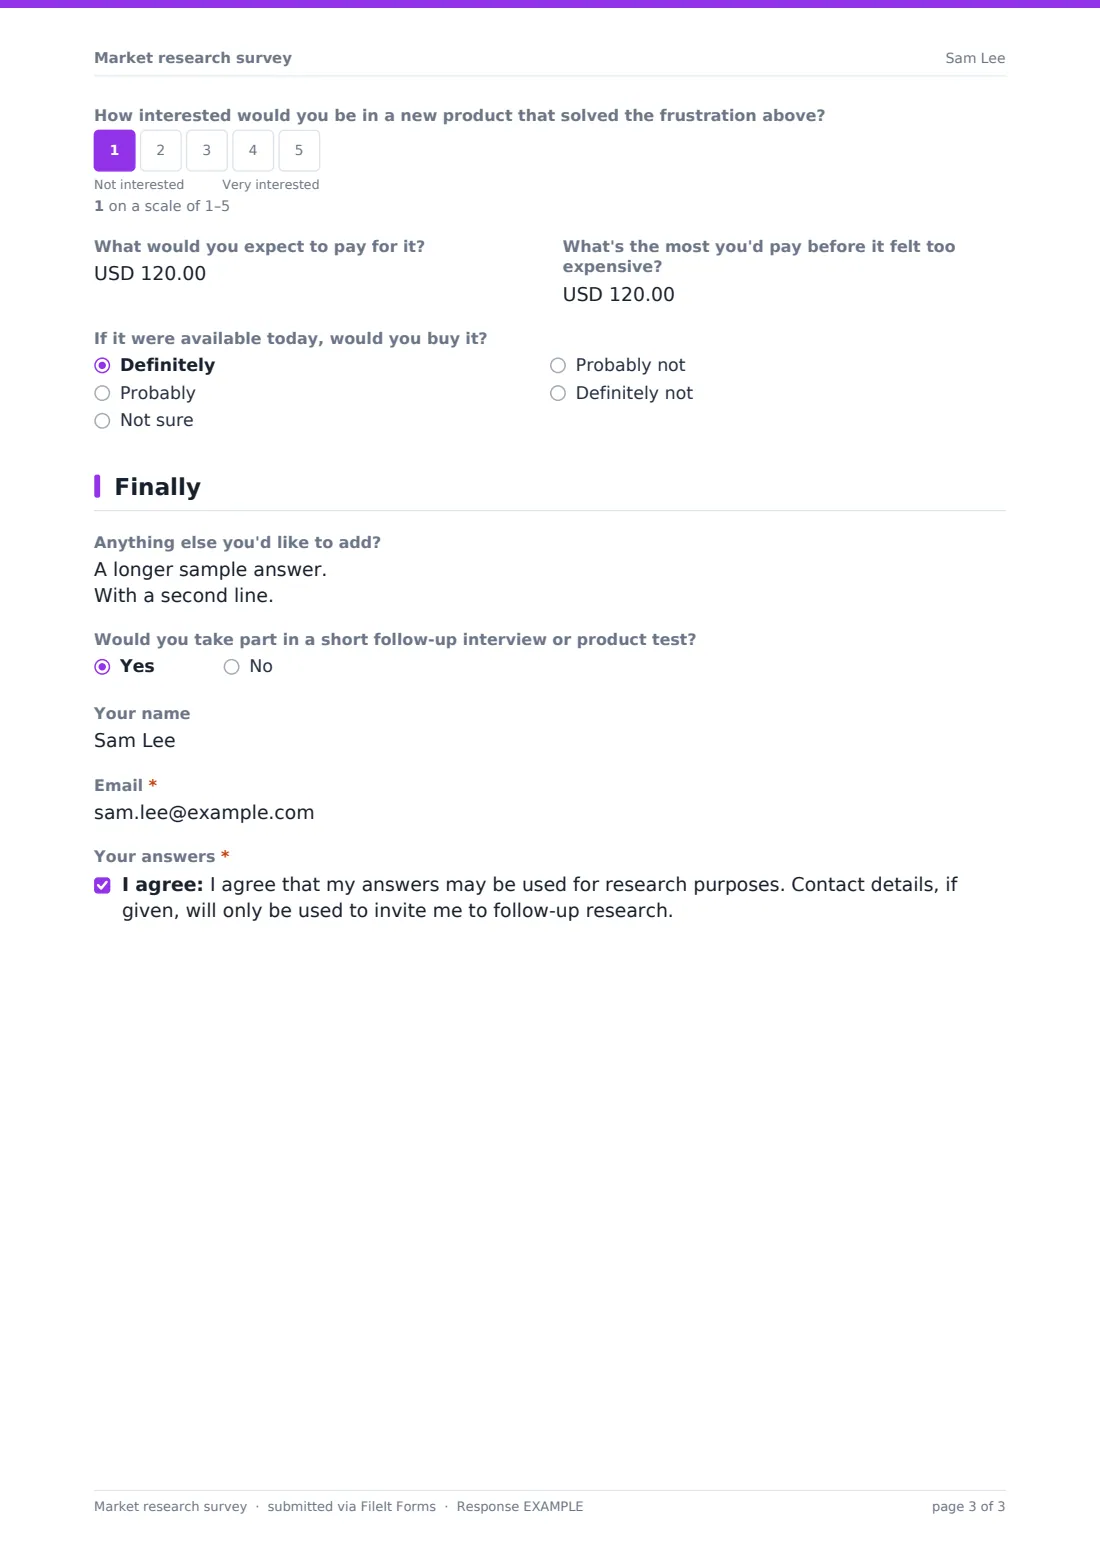
- How interested would you be in a new product that solved the frustration above?
- What would you expect to pay for it?
- What's the most you'd pay before it felt too expensive?
- If it were available today, would you buy it? Definitely · Probably · Not sure · Probably not · Definitely not
4 Finally
- Anything else you'd like to add?
- Would you take part in a short follow-up interview or product test?
- Your name asked only when it applies
- Email* asked only when it applies
- Your answers*
The market research survey form, page by page
1 About you
Respondents give their age range (required), gender, country and region, the type of area they live in, household size, employment and household income. Age, gender and income each include a prefer-not-to-say option (gender can also be self-described), and only age is required.
2 How you buy today
A required question asks how often they buy in the category; anyone who never does is asked why. Everyone else ticks where they buy, give a monthly spend range, name the brand or provider they use most and rate it out of 5. A grid rates how important price, quality, brand reputation, reviews, convenience, environmental impact, customer service and local production are to them.
3 Your needs
Respondents describe their biggest frustration with today's options and pick up to three things they'd value most. A 1–5 scale measures interest in a product that solved that frustration, followed by what they'd expect to pay, the most they'd pay before it felt too expensive, and whether they'd buy it today.
4 Finally
Respondents can add comments, volunteer for a follow-up interview or product test (which asks for their name and email), and give their required consent for their answers to be used for research.
Make the template yours
- Replace "this category" wording with your actual product category
- Change the income ranges and currency to fit your country
- Describe your product concept in a paragraph above the interest question
- Edit the decision factors and wishlist to reflect your market
- Remove demographic questions you don't need
- Set a maximum number of responses for a fixed sample size
Tips for a better market research survey form
- Only ask demographic questions you'll actually use in your analysis
- Describe your concept clearly and neutrally before the interest question
- Treat stated purchase intent with caution; people often overestimate it
- Share the survey with your target market, not just friends and family
- Thank respondents and, where possible, share what you learned
Every response becomes a PDF in your vault
Each response is saved as a PDF in the vault folder you choose. For large surveys you may want to turn off owner notifications in the settings.
Export the Responses table to CSV for analysis in a spreadsheet — segment answers by age, area or buying frequency and compare price expectations.
- Start from this template. It opens in the FileIt Forms designer — change any question, add pages, set the rules for when questions appear.
- Share it. Turn on a public link, or send it to people by email, each with their own link. They don’t need a FileIt account.
- Get the answers as PDFs. Each response is saved as a PDF in the vault folder you choose, with uploaded files attached — and listed in a Responses table you can export to CSV.
Market research survey form: frequently asked questions
Is this market research survey template free?
Yes. It's included in the Forms app on every FileIt account, including the free plan.
Is the survey anonymous?
Yes, unless respondents volunteer for follow-up research and leave their name and email.
Can I change the currency and income ranges?
Yes. Edit the options and currency fields in the designer.
Does FileIt analyse the results?
No. Export the responses to CSV and analyse them in a spreadsheet or statistics tool.
Can I limit how many responses I collect?
Yes. Set a maximum number of responses or a closing date in the form's settings.
Can I offer a prize draw?
You can add a question and consent for a prize draw. Check the rules for prize promotions where you run the survey.
Can I remove the demographic questions?
Yes. Every question can be edited or removed.